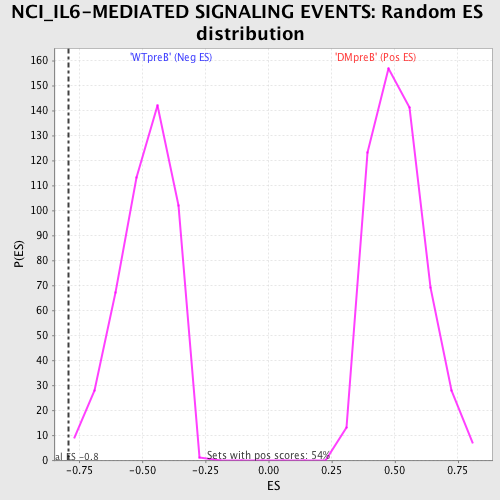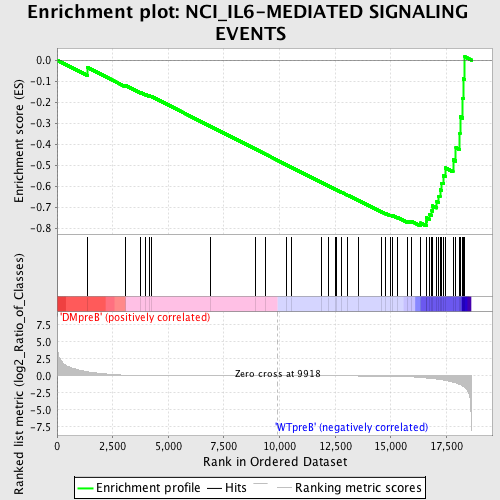
Profile of the Running ES Score & Positions of GeneSet Members on the Rank Ordered List
| Dataset | Set_04_DMpreB_versus_WTpreB.phenotype_DMpreB_versus_WTpreB.cls #DMpreB_versus_WTpreB |
| Phenotype | phenotype_DMpreB_versus_WTpreB.cls#DMpreB_versus_WTpreB |
| Upregulated in class | WTpreB |
| GeneSet | NCI_IL6-MEDIATED SIGNALING EVENTS |
| Enrichment Score (ES) | -0.7902215 |
| Normalized Enrichment Score (NES) | -1.6246142 |
| Nominal p-value | 0.0021645022 |
| FDR q-value | 0.03675065 |
| FWER p-Value | 0.273 |
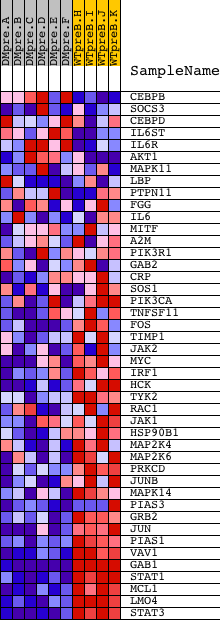
| PROBE | DESCRIPTION (from dataset) | GENE SYMBOL | GENE_TITLE | RANK IN GENE LIST | RANK METRIC SCORE | RUNNING ES | CORE ENRICHMENT | |
|---|---|---|---|---|---|---|---|---|
| 1 | CEBPB | 8733 | 1369 | 0.609 | -0.0355 | No | ||
| 2 | SOCS3 | 20131 | 3056 | 0.101 | -0.1199 | No | ||
| 3 | CEBPD | 22846 | 3750 | 0.050 | -0.1540 | No | ||
| 4 | IL6ST | 4920 | 3981 | 0.041 | -0.1638 | No | ||
| 5 | IL6R | 1862 4919 | 4135 | 0.037 | -0.1697 | No | ||
| 6 | AKT1 | 8568 | 4238 | 0.034 | -0.1731 | No | ||
| 7 | MAPK11 | 2264 9618 22163 | 6874 | 0.008 | -0.3144 | No | ||
| 8 | LBP | 14760 | 8894 | 0.002 | -0.4230 | No | ||
| 9 | PTPN11 | 5326 16391 9660 | 9360 | 0.001 | -0.4480 | No | ||
| 10 | FGG | 1891 | 10299 | -0.001 | -0.4984 | No | ||
| 11 | IL6 | 16895 | 10534 | -0.001 | -0.5109 | No | ||
| 12 | MITF | 17349 | 11903 | -0.005 | -0.5842 | No | ||
| 13 | A2M | 17298 | 12200 | -0.006 | -0.5998 | No | ||
| 14 | PIK3R1 | 3170 | 12501 | -0.008 | -0.6154 | No | ||
| 15 | GAB2 | 1821 18184 2025 | 12547 | -0.008 | -0.6174 | No | ||
| 16 | CRP | 8793 | 12766 | -0.009 | -0.6285 | No | ||
| 17 | SOS1 | 5476 | 13043 | -0.010 | -0.6427 | No | ||
| 18 | PIK3CA | 9562 | 13536 | -0.014 | -0.6684 | No | ||
| 19 | TNFSF11 | 21745 | 14574 | -0.031 | -0.7223 | No | ||
| 20 | FOS | 21202 | 14780 | -0.038 | -0.7309 | No | ||
| 21 | TIMP1 | 24366 | 14969 | -0.045 | -0.7383 | No | ||
| 22 | JAK2 | 23893 9197 3706 | 15078 | -0.050 | -0.7409 | No | ||
| 23 | MYC | 22465 9435 | 15293 | -0.062 | -0.7486 | No | ||
| 24 | IRF1 | 1336 1258 1433 9182 | 15764 | -0.106 | -0.7672 | No | ||
| 25 | HCK | 14787 | 15924 | -0.131 | -0.7676 | No | ||
| 26 | TYK2 | 12058 19215 | 16346 | -0.228 | -0.7759 | Yes | ||
| 27 | RAC1 | 16302 | 16592 | -0.304 | -0.7700 | Yes | ||
| 28 | JAK1 | 15827 | 16601 | -0.307 | -0.7511 | Yes | ||
| 29 | HSP90B1 | 19657 | 16743 | -0.354 | -0.7364 | Yes | ||
| 30 | MAP2K4 | 20405 | 16842 | -0.384 | -0.7176 | Yes | ||
| 31 | MAP2K6 | 20614 1414 | 16879 | -0.397 | -0.6946 | Yes | ||
| 32 | PRKCD | 21897 | 17066 | -0.470 | -0.6750 | Yes | ||
| 33 | JUNB | 9201 | 17155 | -0.511 | -0.6477 | Yes | ||
| 34 | MAPK14 | 23313 | 17215 | -0.531 | -0.6174 | Yes | ||
| 35 | PIAS3 | 15491 672 1906 | 17286 | -0.567 | -0.5856 | Yes | ||
| 36 | GRB2 | 20149 | 17370 | -0.613 | -0.5515 | Yes | ||
| 37 | JUN | 15832 | 17458 | -0.677 | -0.5136 | Yes | ||
| 38 | PIAS1 | 7126 | 17797 | -0.905 | -0.4749 | Yes | ||
| 39 | VAV1 | 23173 | 17925 | -1.033 | -0.4168 | Yes | ||
| 40 | GAB1 | 18828 | 18101 | -1.234 | -0.3487 | Yes | ||
| 41 | STAT1 | 3936 5524 | 18114 | -1.257 | -0.2703 | Yes | ||
| 42 | MCL1 | 15502 | 18232 | -1.480 | -0.1836 | Yes | ||
| 43 | LMO4 | 15151 | 18255 | -1.527 | -0.0888 | Yes | ||
| 44 | STAT3 | 5525 9906 | 18327 | -1.720 | 0.0156 | Yes |